
A layout that
fits your thinking.
Compare multiple charts side by side. Keep an eye on the broader market while studying a single symbol.
Multi-chart layoutsA professional market analysis platform for
charting, strategy development and trade discipline.
01 / The workspace
Start with a clean view. Add the context that matters to you. Keep your research, tools and ideas close to the chart.
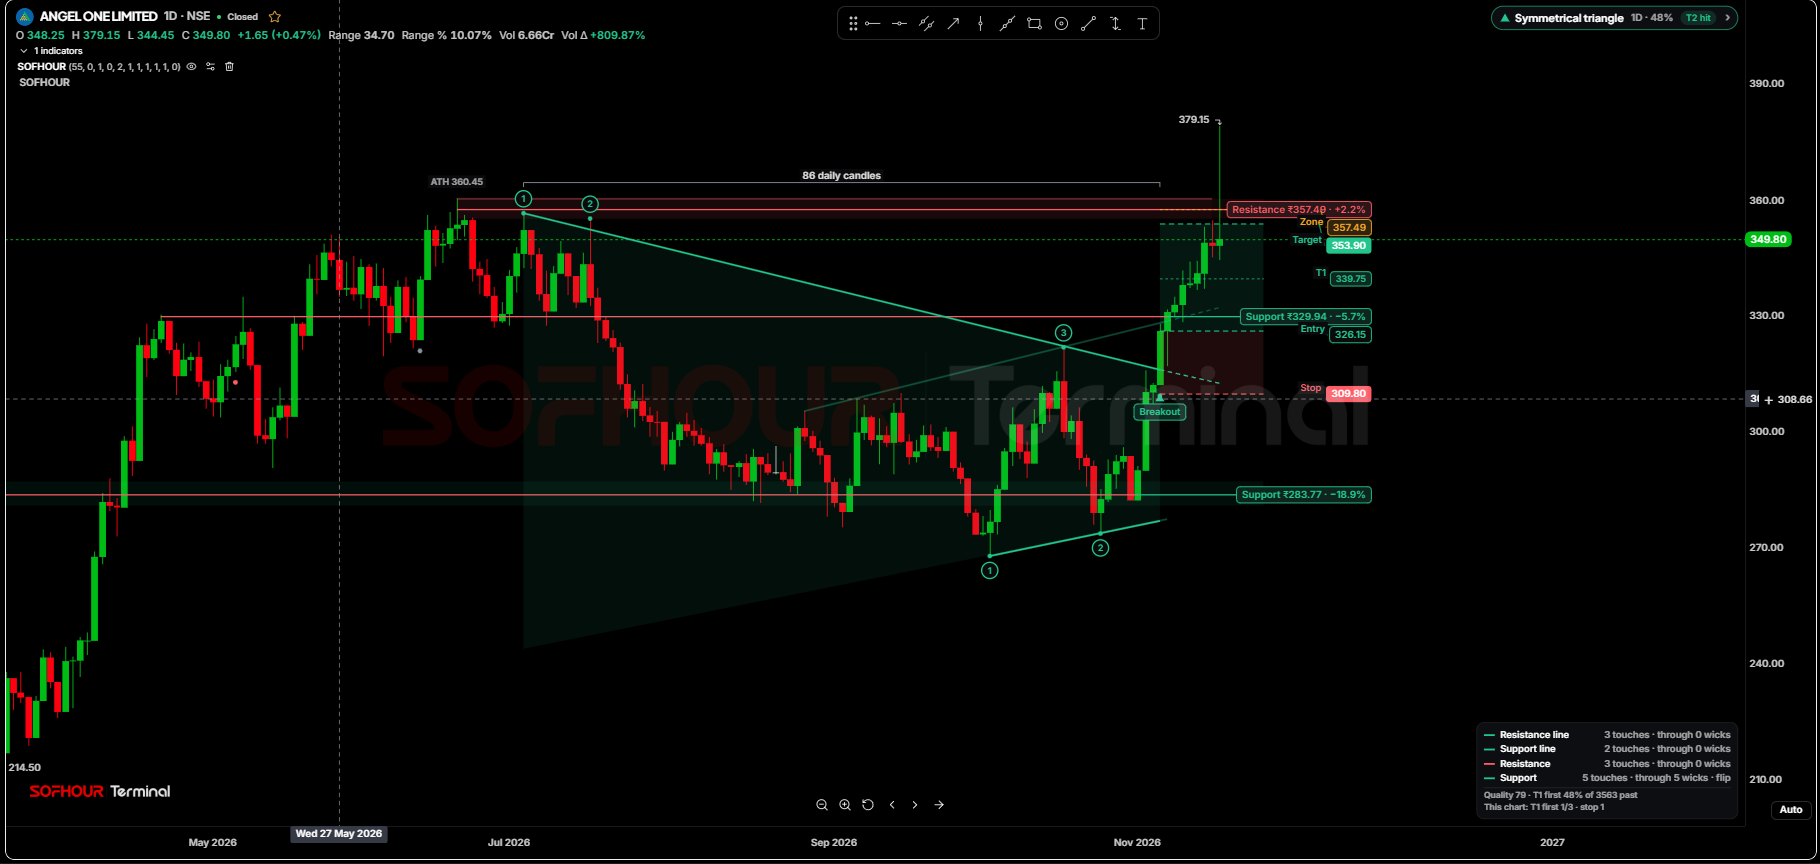
Compare symbols, choose your timeframes and arrange multiple charts in one workspace. Switch between light and dark to suit your focus.
Try the chart02 / Made for your workflow
Compare multiple charts side by side. Keep an eye on the broader market while studying a single symbol.
Multi-chart layouts
Trendlines, paths, brushes and text templates turn observations into a clear, personal research canvas.
Drawing studio
Add indicators and volume studies. Explore pattern tools and marked levels alongside your own analysis.
Indicators & patterns
Build a watchlist, find your symbols and move between the markets you follow without losing focus.
Personal watchlists
Save a clear 4K image of your chart layout, complete with the context and annotations you created.
4K chart exports
Keep drawings and workspace preferences saved so you can return to the research you were building.
Saved workspaceDrag, swipe or use the arrows to explore the tools.
03 / A wider perspective
Follow an Indian index. Study a US stock. Explore crypto or forex. Bring a consistent charting workflow to the markets you care about.
Explore marketsStocks, indices & derivatives
Equities, ETFs & indices
Digital asset charting
Currencies, metals & energy
04 / The SOFHOUR ecosystem
Move from market research to practice and reflection with the rest of SOFHOUR.
05 / Good to know
Select “Open chart” or “Launch ChartX”. You’ll reach the existing chart workspace and can sign in there.
Yes. The chart workspace has responsive mobile navigation and layouts, with tools accessible from the mobile interface.
No. The product image is an illustrative capture. Open the chart to view available market data and its session/source status. Availability varies by instrument and provider.
No. Chart tools and pattern outputs support your research; they are not guarantees or investment advice. Markets involve risk, and you should make your own assessment.
The chart workspace supports 4K image exports, including the selected layout and your chart annotations.
Your next perspective starts here.